Welcome to EV's point and figures. This blog is dedicated to the use of point and figure charts in technical analysis.

Although P&F first appeared in charts in the 1930's, it is an often overlooked techique for analysing stocks and charts. A poor relation compared to line and bar charts and their range of momentum indicators. Yet few charts provide a clearer picture of the daily battle between bulls and bears for market control.

Like most methods, it should not be used in isolation. It should form part of an analysts 'tool box' and be used with other techniques to help form an overall view.

The charts that appear on this blog and any accompanying comments are purely for information purposes only - my own personal take on where the prices may be heading. They do not constitute investment advice.

Wednesday, October 27, 2010

The NYSE Bullish Percent Index

I shall credit Tom Dorsey with his explanatory notes on this one.

Dorsey notes that market indices hide reality. Moves in a small number of stocks can drive the index higher. The bullish percent index assesses risk in the market, not performance.

It's a compilation of the percentage of (net) stocks on NYSE (1,831 at 26.10.2010) showing their first point and figure buy signal. Calculated weekly, each box represents 2% and the vertical axis runs from 0% to 100%.

If there are 1,831 stocks in the index and say 920 on P&F buy signals, the bullish percent is 50%. It only records the FIRST buy signal, all subsequent buy signals are not counted.

If the index had 100 stocks and over the next week 12 stocks experience a new buy signal and 10 stocks experience a new sell signal, that net 2% increase would fill an X box in a rising column of X's. In other words a 2% net change allows the chart to rise by one box.

Using the same 3 box reversal technique as for normal P&F's to shift columns in the index takes a (3x2%) 6% net buy/sell signal to cause a reversal and vice versa. As a rule of thumb, areas above 70% and below 30% are the extremes. Above 70% is over bought and below 30% is over sold.

'The names Bond....falling 30 year Bond'

Now I feel on slightly dodgy ground here as the long bond is an obvious target for the Fed's QE machine and they are naturally desperate to keep long term borrowing rates down. But this is the current picture and remember the concept of modified duration. Small movements in yield have proportionately larger movements in price. In the case of the 30 year its around 17% in price for a 1% move in interest rates.

The yield on the 30 year bottomed at 3.55% on this chart in Aug/Sep and since then has been creeping up. The initial target of 39.25 (3.925%?) was met and we also have another active target to the upside of 4.225%. I've ignored the column of X's to the right of that target as the column of 0's next to it fell below the base of the X column at 37. The last column of X's which recently reversed in to that column of 3 0's has given an unactivated upside target of 46.25 (ie 4.625%)For that to become active, we need to see the yield move above that red horizontal line, filling the 40 box and remaining above that level. What has this move in yield done to the price?
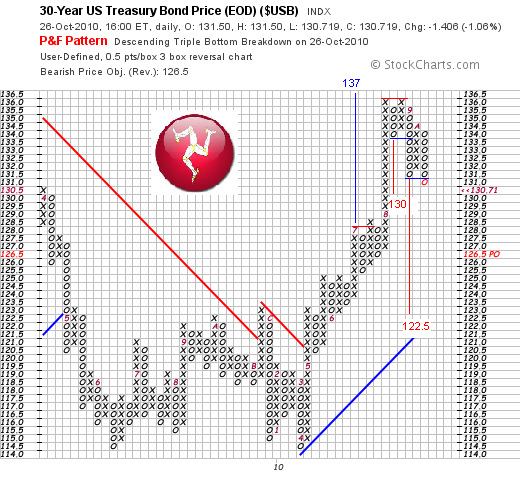

Well here's the answer. The price got as high as $136, so the activated target of $137 in July was pretty close. But it was unable to move higher and since then it has fallen by about 4.4%. The first active downside target of $130, given by the column of four 0's off the top is close to being met. But unlike the yield chart, we already have active targets to the downside with double bottoms and lower tops - that's the modified duration! You'll see the current column of 0's has just filled the box below the previous column of 0's, activating that target of $122, which would be 10.2% decline from the top.
.
This may not play out because the 30 year is fair game for the Fed (after all, the P&F charts suggested equity markets were rolling over nicely in summer before the Fed planted the thought of further QE in the markets mind in September). But its what the chart is currently predicting!


Tuesday, October 26, 2010

FTSE 100: 15 minute 5x3

From Proquote, not renound for the quality of their P&F charts but we'll give it a go. This 15 minute 5x3 hints of a double top. There is some previous support at 5,680 to overcome but we have an active downside target of 5595.

Friday, October 22, 2010

Petrobras (PBR): triple bottom sell signal

The upside target ($69) is still active. May see some support at $30, a previous support level. Triple bottom sell signal, with bearish resistance (red sloping line), active targets to downside of $23 and $12

S&P/TSX Mining Index - digging its way......higher!

Mining stocks led the recovery in stock markets - that was certainly the case with the FTSE 100 anyway. This index only tracks companies listed for at least 12 months on TSX, NYSE, NASDAQ.

Its interesting to compare this bigger picture with that of the Wilshire and Dow as I did yesterday. Some might argue that 'its all gold' and the of the 107 companies in this index 36 are indeed gold miners but their weighting is small - 17.7%. Diversified metals and mining is the largest weight -39 companies, 59.7% of the index.

Interesting to note that this index did not have an April 2010 high - it didn't have a March 09 low either, having reached its low in the back end of 08. It's recovery high came in Jan, three months before the mainstream equity Indices. It also looked like it was going to roll over perfectly until very recently but has now taken out the Jan high and (for now at least) appears to be well on its way to a rendezvous with its previous peak in May 2008.

Thursday, October 21, 2010

Wilshire 5000; similar perspective

Again, just a quick look at these charts show how important the April high is (to bulls and bears).

There has been some distribution recently on the 25x3 closing chart above, and we also have an unactivated downside target of 11,950. The current column of X's will need to reverse in to a new column of O's and move below 12,275 for this to become active. The three price objectives to the upside are all active. But remember these targets are for guidance, they do not always get met. Even here, although 325 points away, it has the 'look' of a double top.


Again, here is a bigger picture, 100x3 chart, showing the high of 2007 in the top left corner. The April 2010 high is of course the highest level the market reached from the 2009 bottom, before reversing. There is still an active downside target of 9,500 and an active target to the upside of 13,800. The horizontal red lines could form resistance levels showing previous highs before the market reversed (should also be one at the 13,300 level).


Dow perspectives: the double top case


These longer term P&F charts, showing the 100x3 close (above) and 50x3 close on the Dow Jones provide a bit more perspective. For now, it does indeed look like a forming double top. Remember, 100x3 charts require 100 points to fill one box and 300 points to reverse a column to the upside or downside, so can take time to form. This one goes all the way back to 2003.
To illustrate how important the April high level is, I have listed what I see as the 'active' price targets supported by the 100x3 chart. There are still multiple targets to the upside and currently only one active target to the downside (8,800). The 13,300 target created by the most recent column of X's is not active yet (and has not been placed on the chart).

If the index can punch above the April high and move through the red horizontal line, one would have to concede that the bulls are firmly in control. It would almost bring in to play the possibility of moving up towards the 'larger' double top rendezvous, back at the all time high of 2007.

We will know very soon how this will go.