The recent action has clearly been quite violent and it may have been better for me to wait a few days to see if there are any reversals to the upside, but this is the current assessment (
posted in homage to the mighty Iron Maiden, whose final gig of their 'Final Frontier' World Tour at the O2 in London this Sats i'm very much looking forward to - up the Irons!).The overall observation is that despite the recent carnage, all of them (save the Nasdaq) are close to levels where they have found support in the past. The RUT looks to be on quite shaky ground to me but may hop back above its support level (see below). For the bears to confirm they have the ball, I'd be looking to see some sort of reversal to the upside first, then look for the bears to come back in and move these indices decisively lower. The initiative is clearly with the bears for now. A further dose of QE will require a reassessment but no sign of that at present.

Starting with the Russell 2000 (5x3), the most obvious point to note is that the
blue bullish support line was taken out with the recent decline and we now have bearish resistance, as evidenced by the downward sloping red line. I'm not seeing this on the Dow or Nasdaq.
The first target from the top of 770 was achieved and I have another active target to the downside of 675. However, its quite possible that we may get a reversal to the upside first, as it can be seen that the RUT has had support at the 775 level on 4 previous occasions. I'd be more confident about the 675 target if we get a reversal to the upside first, then another reversal and a decisive move below 770 - this would indicate to me that the bears are firmly in control.
At the moment, there are no obvious targets to the upside, either active or inactive.

I'm using the Dow 100x3 PF to strip out a lot of 'noise' that would be evident with the 50x3 chart. Note here that this chart still has a long term bullish support line in place, which must be respected for now at least (I'll keep an eye on the 50x3 because if we do get a short term reversal, hopefully it will throw up something more meaningful than at present).
The first target from the YTD high of 10,100, given by that column of nine 0's is yet to be activated (sorry, meant to reference 'ua' beside it). The reason being that the index has not fallen below the level where this column reversed back up (11,900). In fact the Dow got subsequent support at this level and we are right on that line again, post yesterday's action.
There is an active target in place of 11,500. And without showing any bias, to the upside there is still an active target in place of 14,500 but note the clear resistance at 12,700.
Just for info, on the 'noisy' 25x3 PF for the Dow (not shown), the Index is currently filling a box at 11,875, where it has found support twice ( in June/July)prior to reversing. So it is possible that we may see that happen again -the index would need to rise by (25x3) 75 points to create a new column of X's.

The S&P 5x3 is slightly 'non descript' at present. The upside target of 1,365 came close to being met prior to the market reversing and we are now close to to the downside target of 1,235, post the recent action.
Note the current column of 18 o's has pushed through the blue bullish support line and we have bearish resistance overhead.
Had it not been for the move below the bullish support line, one potential pattern to keep an eye out for was a 'long tail down' which occurs when the stock/index declines 20 boxes without a reversal - it's a slight rule breach here because according to Tom Dorsey, it can present a potential trading opportunity if the index stays
above the support area (
which has not happened here). You would buy on the first 3 box reversal to the upside and put in place a stop loss in the box below the 'long tail' (ie stop out on the next double bottom sell signal).

The 10x3 less noisy chart provides a bit more clarity. The index is currently resting at an area where is have previously found support and reversed to the upside. There is an active target to the downside of 1,200 and an inactive one of 1,040. Again, ideally one would be looking for some sort of bounce, then a reveral to the downside, decisively taking out the 1,260/1,250 levels.
There is technically an upside active target of 1,490 still in place and see on this chart the blue bullish support line prevails and must be respected for the time being.

Finally, the Nasdaq (25x3) continues to enjoy bullish support but appears to be topping (on the 10x3 chart, the bullish support line was recently taken out at 2,700 but the chart looks very noisy, hence the use of 25 points per box).
There is resistance at 2,875 (the bears have come in twice at this level and pushed the index lower) and there is an active target of 2,500 below (which the index is pretty close to now).
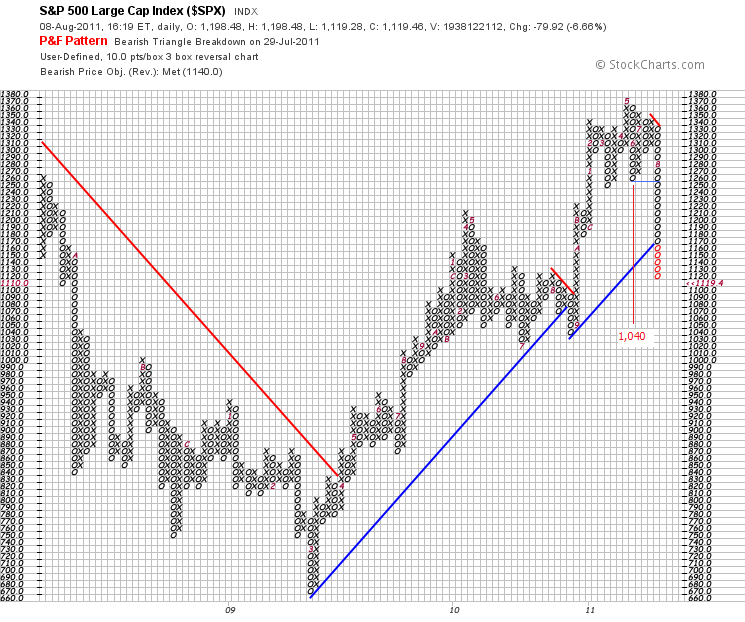
 There is a triangle forming on this 10x3 HL PF - it needs 5 columns to complete. There is an active target in place of 1,040, given by the first column of 0's from the top. We now have two un-activated targets - one to the upside of 1,380, which would get the SPX to a new high and one to the downside of 990, which would get SPX close to a previous support level.


