The 25x3 P&F on the RUT. Both the high/low method and closing method have an active target to the downside of 760.
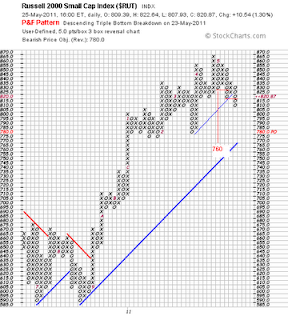
The long term bullish support line is still in play on the H/L chart above. The recent move down has taken out the more minor support but until the main trend line breaks, the overall uptrend is said to hold.

To show no bias I have included an upside target on the 'closing method' 25x3 P&F above as technically its still there and active. But it can be seen that the most recent action is bearish, with the previous level of support being taken out at 830. Again, the main bullish support line is nowhere near to being challenged but the index is pushing on those minor support lines that i've added.
 The long term bullish support line is still in play on the H/L chart above. The recent move down has taken out the more minor support but until the main trend line breaks, the overall uptrend is said to hold.
 To show no bias I have included an upside target on the 'closing method' 25x3 P&F above as technically its still there and active. But it can be seen that the most recent action is bearish, with the previous level of support being taken out at 830. Again, the main bullish support line is nowhere near to being challenged but the index is pushing on those minor support lines that i've added.
No comments:
Post a Comment