Welcome to EV's point and figures. This blog is dedicated to the use of point and figure charts in technical analysis.

Although P&F first appeared in charts in the 1930's, it is an often overlooked techique for analysing stocks and charts. A poor relation compared to line and bar charts and their range of momentum indicators. Yet few charts provide a clearer picture of the daily battle between bulls and bears for market control.

Like most methods, it should not be used in isolation. It should form part of an analysts 'tool box' and be used with other techniques to help form an overall view.

The charts that appear on this blog and any accompanying comments are purely for information purposes only - my own personal take on where the prices may be heading. They do not constitute investment advice.

Tuesday, August 23, 2011

SPX 10x3 - forming triangle

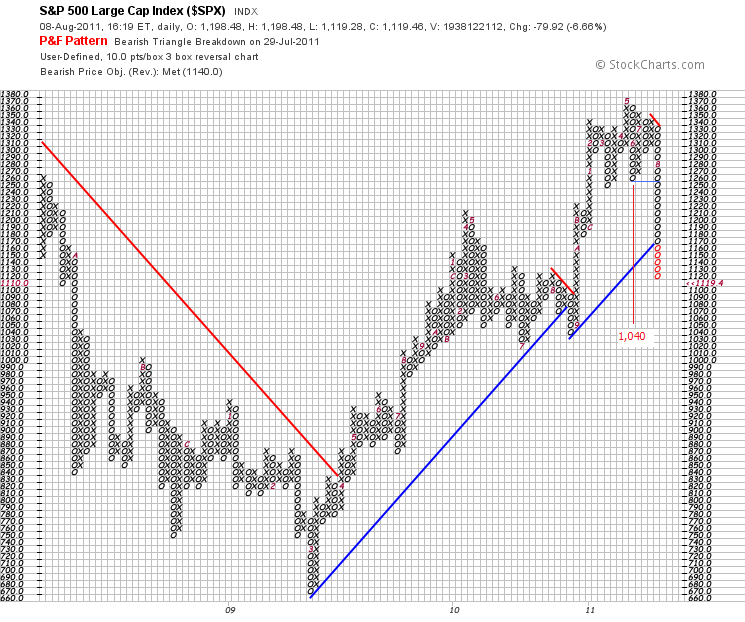
There is a triangle forming on this 10x3 HL PF - it needs 5 columns to complete. There is an active target in place of 1,040, given by the first column of 0's from the top. We now have two un-activated targets - one to the upside of 1,380, which would get the SPX to a new high and one to the downside of 990, which would get SPX close to a previous support level.

To activate the target to the upside, the index needs to pass through 1,210. To activate 990, the index needs to reverse and move through 1,120 and ideally 1,110.

The index pushed through the long term blue bullish support line at 1,170 and is currently in a state of bearish resistance, as denoted by the red line. Unfortunately I won't be around to see how this resolves, i'm off on holiday after tomorrow!

Greece - yields still rising!

It's all gone a bit quiet on the Greek front but I suspect for not much longer - the last €12bn of the 'first' EU bailout was approved in June but will be gone by the end of August. The 'new' €120bn bailout will be issued in tranches but is dependent on Greece demonstrating it is implementing draconain austerity measures while growing its economy!! These bond yield suggest non compliance!


Thursday, August 18, 2011

SPX update: 1040 still a target

It was a target given by the first column of 0's down from the top and remains a much more 'natural' spot for the market to find support, as it did in Sept last year.


Friday, August 12, 2011

FTSE 100 - forming head and shoulders?

Although P&F charts do not use time on the y axis, they are quite capable of throwing up patterns that you see in other charts, so here is something to ponder.

Could this be the early formation of a right shouldder in a developing head and shoulders pattern. See how the FTSE found solid support (eventually) at 4,800, an level it found clear support at last summer. That measure from the top (6,100) to 4,800 was 1,300 points. If one were to assume this was the neckline, that would provide a target of 3,500, a level where the index found clear support in March 2009.

It may not play out this way but it is plausible that the index could consolidate in a band between 5,050 and 5,400 before eventually giving way and move over. This would be an alternative to another straight down decline similar to the one just witnessed. The 'unactive' target from that most recent column of 23 O's is 2,500, which just does not seem realistic to me (although i'll stand corrected if something really nasty happens!). If the market consolidates for a while, we will start to see new targets to the downside that (if this scenario were to play out) would bring 4,100 in first (also a previous support level), then 3,500.

We'll see !!


Wednesday, August 10, 2011

FXF

Some negative divergence on the slow stochastic (which touched 100 in mid July) and the RSI has never been higher. So on normal measures it looks over-bought but I suppose it could grind higher as long as fear supports CHF.

Monday, August 8, 2011

SPX - 1,040?

This target was activated when SPX moved below 1,250, just last week (see earlier 'Maiden' posting on US indices on Weds 3rd August) -it was unactivated at the time).

Just looking at this chart shows the damage wreaked by the bears in the last 5 days. You sense it will rest at 1,040, the area where the market previously found support back in Sept 2010. Note too, the long term blue bullish support line has been breached.


Thursday, August 4, 2011