Welcome to EV's point and figures. This blog is dedicated to the use of point and figure charts in technical analysis.

Although P&F first appeared in charts in the 1930's, it is an often overlooked techique for analysing stocks and charts. A poor relation compared to line and bar charts and their range of momentum indicators. Yet few charts provide a clearer picture of the daily battle between bulls and bears for market control.

Like most methods, it should not be used in isolation. It should form part of an analysts 'tool box' and be used with other techniques to help form an overall view.

The charts that appear on this blog and any accompanying comments are purely for information purposes only - my own personal take on where the prices may be heading. They do not constitute investment advice.

Monday, August 8, 2011

SPX - 1,040?

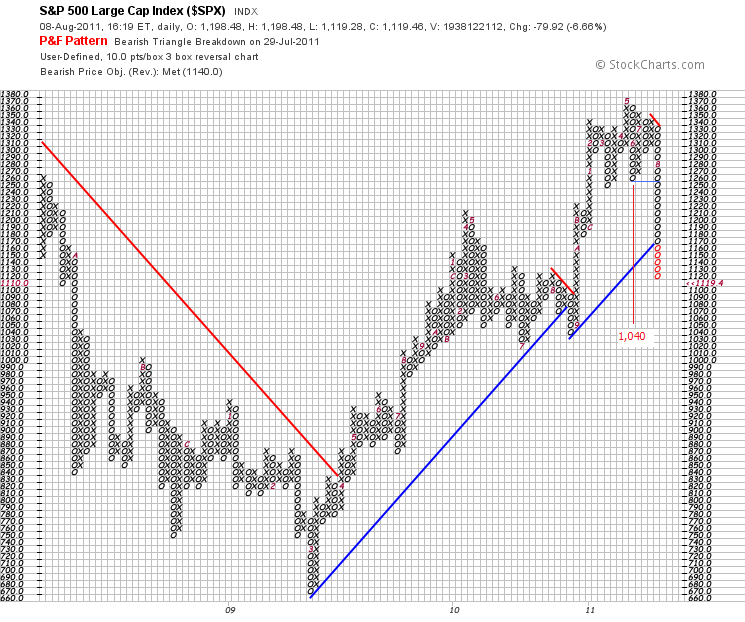
This target was activated when SPX moved below 1,250, just last week (see earlier 'Maiden' posting on US indices on Weds 3rd August) -it was unactivated at the time).

Just looking at this chart shows the damage wreaked by the bears in the last 5 days. You sense it will rest at 1,040, the area where the market previously found support back in Sept 2010. Note too, the long term blue bullish support line has been breached.


No comments:

Post a Comment