 FTSE 100 trading back in the middle of its trading range post this morning's rise (the green crosses)
 The 50x3 chart is less noisy but shows the current trading range very clearly. FTSE 100 trading back in the middle of its trading range post this morning's rise (the green crosses) The 50x3 chart is less noisy but shows the current trading range very clearly.
 If you strip out the Fukushima 'dip and bounce', it can be seen that there is an epic battle being fought between the bulls and bears on the FTSE 100. The bears cannot push the index below 5,875 - its found support here 6 times recently. Similarly, the bulls have failed to clear 6,100 and
  Its interesting to note that this index 'lagged' the QE2 euphoria - sure there was a bounce in Sept but the index did not really shoot higher until Dec/Jan (as denoted by that column ox X's with the number 1 in it (1 being January)). Note that that move pushed the index up towards the 56.5 target given by the initial reveral in September.
 The 0.5x3 chart based on the daily high/low method is also pointing lower. Having peaked in Feb at 55.5, the move down from the top as denoted by the column of 7 o's gave a target of 45 which was activated by the next column of 0's. The bears have been successful in pushing this index lower - since April, each time the bulls came back in and moved the price up, sellers came back in at lower levels than seen previously.
 Following on from last week's post and post today's price action, the 1,250 price target on the 5x3 H/L P&F has been activated (the current column of 0's) going below the previous column (of 0's).
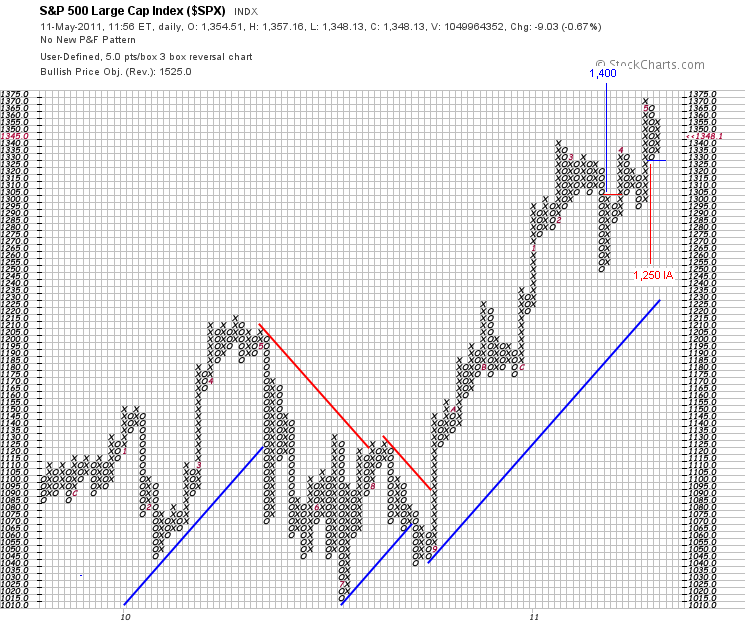 There is a target to the downside of 1,250 but it is not active. It will only be triggered if the current up column of Xs reverses and the next column of 0's fills the 1,325 box.
 On the 1x3 H/L chart - need to see this $149 level hold ideally. Recent support has been punctured, giving active targets to downside of $142 and $124. The 'closing' 1x3 chart has an active target to downside of $129.

